Revenue trend, traffic, and popular items
The dashboard charts and lists for your revenue over the last 6 months, storefront visitors, new and returning customers, and your most-booked items.
Where to find it
Dashboard → Revenue Trend, Revenue by Category, Traffic Overview, Customer Acquisition, Popular Items and Staff Activity widgets
These widgets show how your business is doing beyond today: money coming in, who is visiting your website, how many customers are new or returning, and which rentals customers book most.
Where to find it
Look among your dashboard's widgets for the cards titled Revenue Trend (6 months), Revenue by Category, Traffic Overview, Customer Acquisition (6mo), Popular Items and Staff Activity.
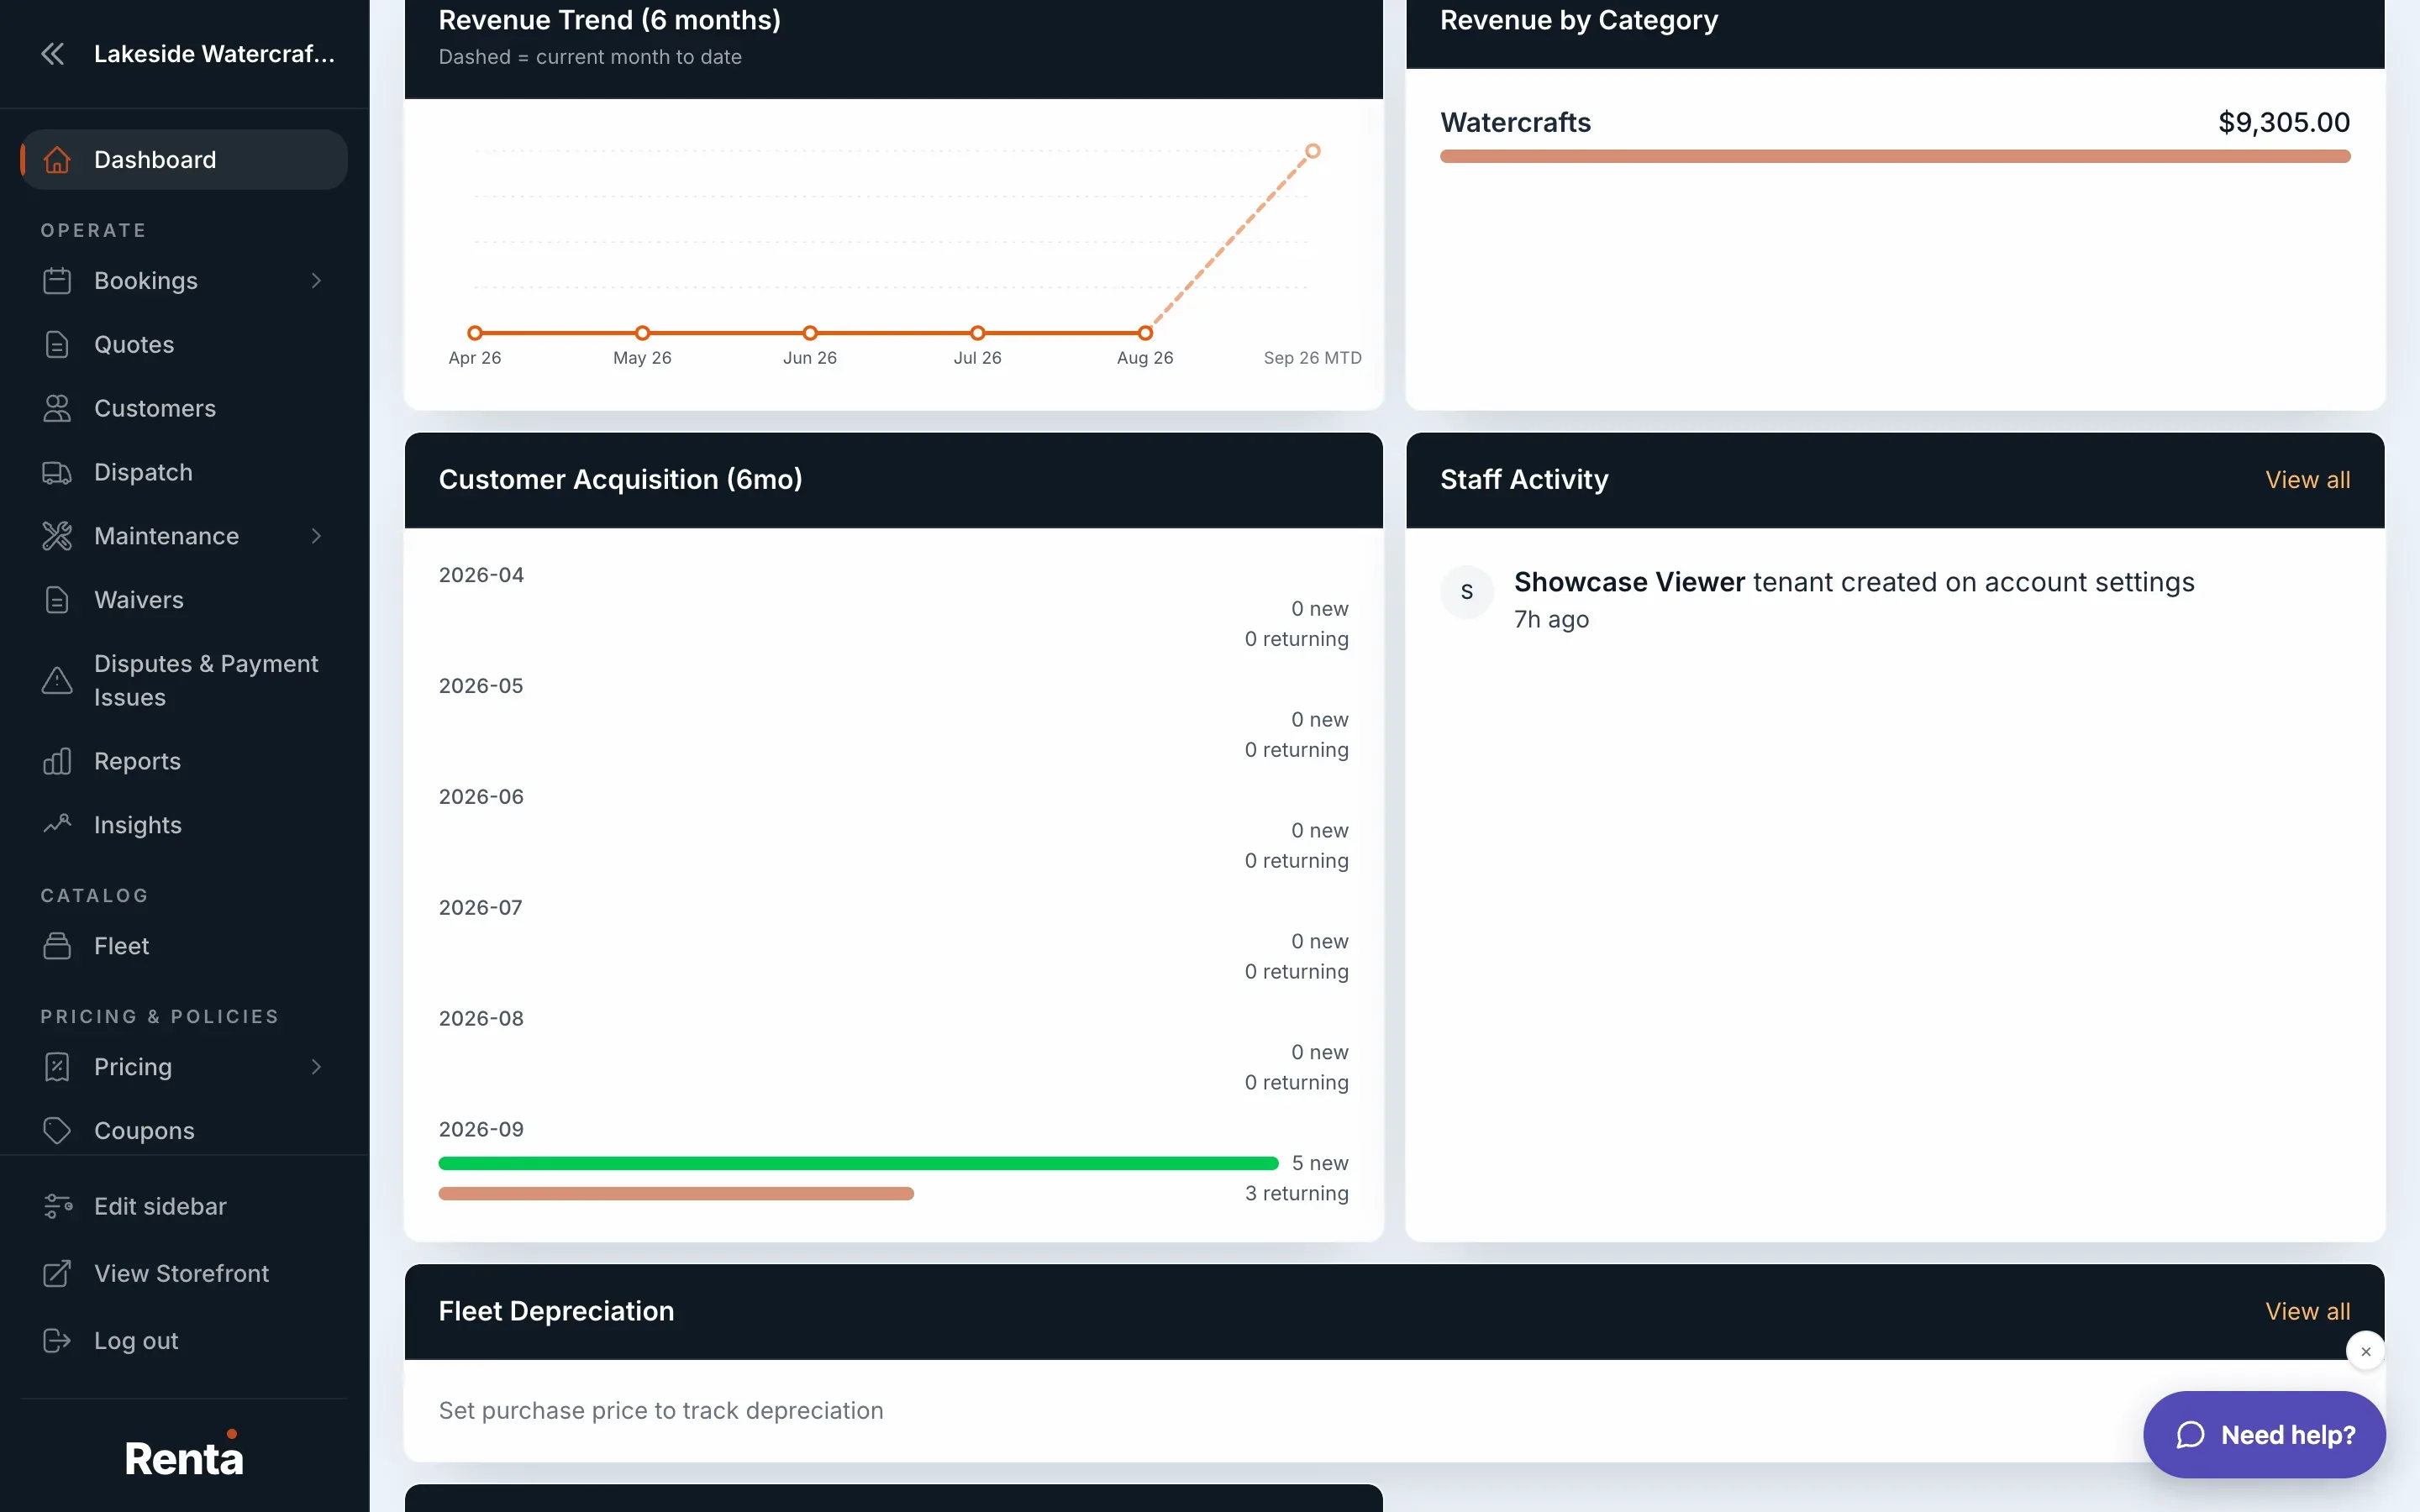 The Revenue Trend chart and Popular Items list
How it works
- Revenue Trend (6 months) — a monthly chart of your revenue over the last 6 months. The current month is drawn as a dashed segment ("Dashed = current month to date") because it is still in progress. With no revenue yet it says "No revenue data yet."
- Revenue by Category — each fleet category with its revenue and a bar showing its share (for example kayaks versus jet skis). It covers the last 12 months, not just this month.
- Traffic Overview — storefront visitors (people visiting your public booking website), for the last 30 days, or "N days so far" if tracking started more recently. It shows a Visitors count, a Visitor → booking percentage and a bar for each day. If the data cannot be loaded, the card says so and tells you to refresh; that is not a count of zero.
- Customer Acquisition (6mo) — for each of the last 6 months, one bar for new customers and one for returning customers, with the counts beside them.
- Popular Items — your top 5 items by bookings over the last 12 months, ranked 1 to 5, each with its name, "N bookings" and the revenue it brought in. Click an item to open it.
- Staff Activity — the 5 most recent actions taken by your staff, each showing the staff member, what they did, what it was done on (for example "a booking" or "a customer") and how long ago. Sign-ins are not listed. Where the action was on a booking, item or customer, click it to open that record. View all opens the audit log.
For example: if Popular Items shows your tandem kayak at 30 bookings and a single kayak at 2, that is a signal to add more tandem kayaks to your fleet.
Good to know
- The dashed line on Revenue Trend only means the current month isn't finished yet. Don't read it as a drop in revenue.
- Fleet Depreciation sits on the same dashboard; see Fleet health and maintenance snapshot.
- For the reportable, filterable version of these figures (with a custom date range), see Revenue, popular items, and repeat customers.
- Traffic and search-specific detail lives separately. See How many people are visiting your site.
Related articles
- Dashboard — common questionsQuick answers on every dashboard card, number and button, how to rearrange or hide widgets, what the calendar colors mean, and why a card is missing or looks empty.
- What's on your dashboardThe at-a-glance widgets showing today's rentals, deliveries, activity, and fleet health when you open Renta.
- Rearranging or hiding dashboard widgetsDrag widgets into a new order, hide the ones you don't use, and restore the default layout any time.
- Google Search and review widgets on your dashboardDashboard cards for your Google search clicks, Google reviews and serious SEO problems.
- Deposits, balances, and refund exposure at a glanceThe dashboard cards showing money held as deposits, money still owed, refunds you have scheduled, and the Past Due box that flags bookings with problems after their return date.
Still stuck? Ask the chat.
Was this helpful?